The FP-8050 Series spectrofluorometers can measure five different types of spectra: emission, excitation, synchronous, single-beam emission and single-beam excitation in both fluorescence and phosphorescence* modes.
*Excludes FP-8250
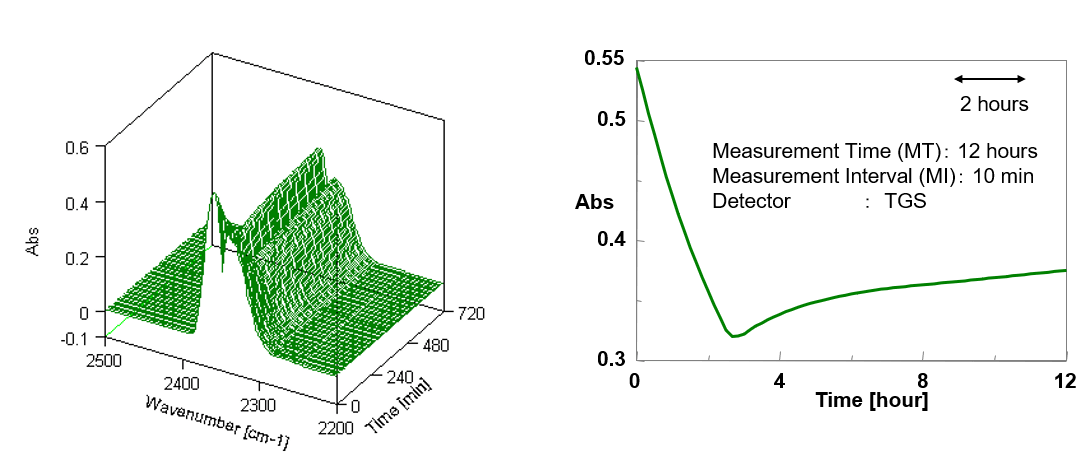
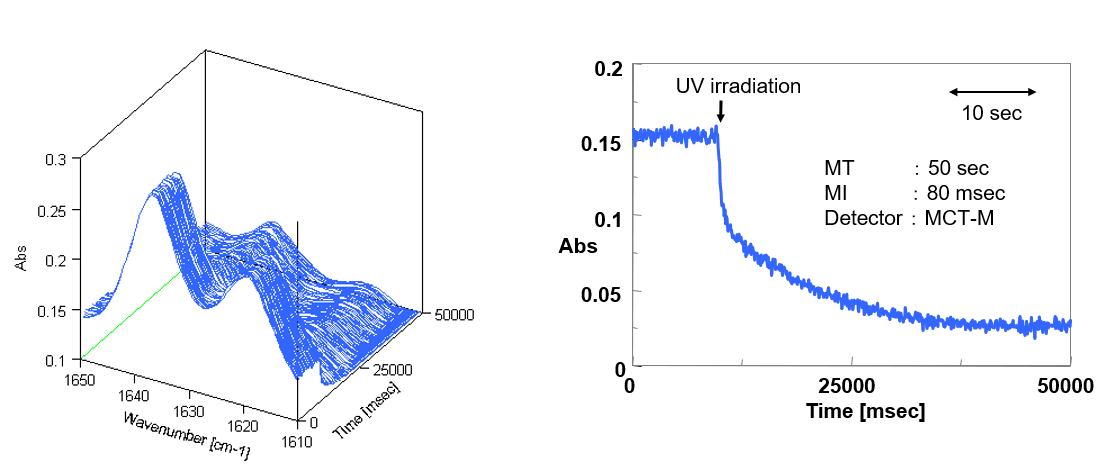
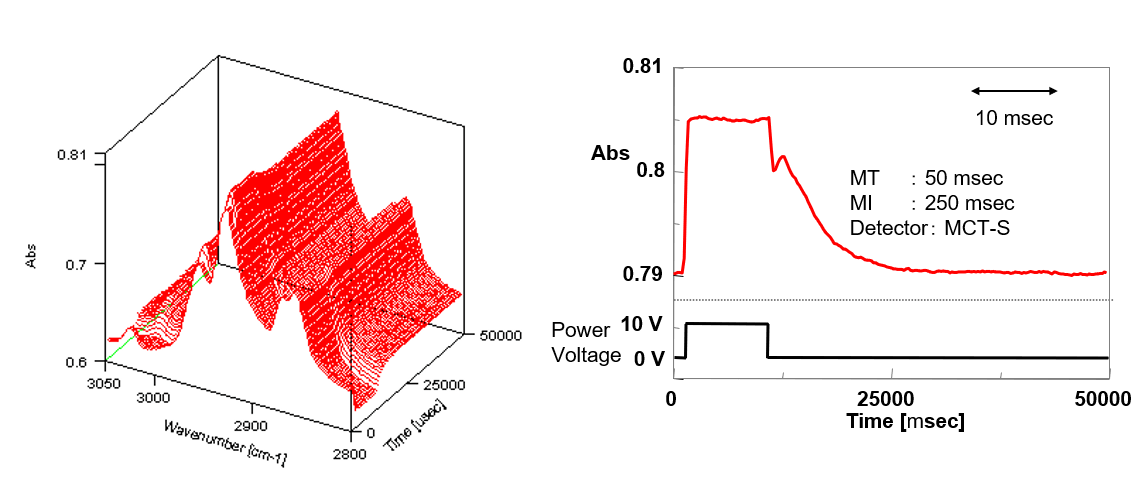
Time Course Measurement
The Time Course Measurement program is intended for measuring temporal changes in fluorescence intensity at a fixed wavelength. Up to 100,000 hours (FP-8350/8550/8650) and 1667 hours (FP-8250) of continuous measurements can be performed using a 60 minute and 60 second interval, respectively.
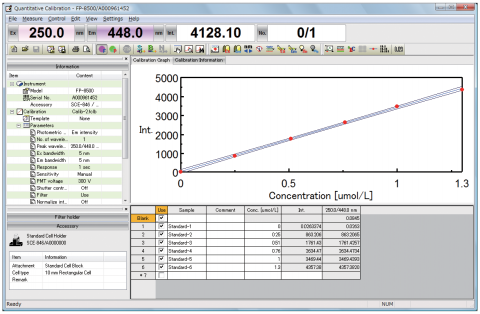
Quantitative Analysis
In the Quantitative Analysis software, optimal parameters from two photometric modes, emission and excitation, and three quantitation modes, no base (1 wavelength), one-point base (2 wavelengths), and two-point base (3 wavelengths) can be selected depending on the application. Other quantitative calibration curves methods such as log or spline functions are also available.
Fixed Wavelength Measurement
This program can be used to measure a sample’s fluorescence or phosphorescence intensity at fixed excitation and emission wavelengths for up to four wavelengths.
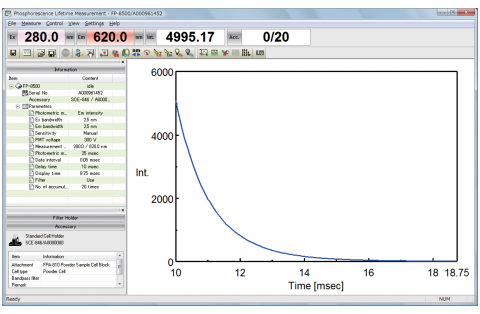
Phosphorescence Lifetime Measurement
Measures changes in the phosphorescence of a sample briefly irradiated by the excitation source.
*Excludes FP-8250
Interval Scan Measurement
Measures up to three spectra (fluorescence, excitation, and synchronous) and displays the results as either 2D or 3D spectra, as well as contour or color-coded plots.
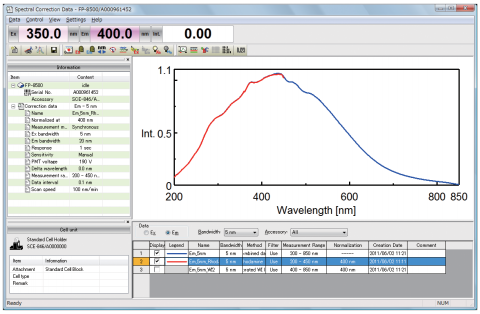
Spectral Correction
Allows users to easily compare measured spectral data from several instruments as well as determine the quantum yield efficiency. Corrected spectra can be obtained immediately after the measurement is completed. The FP-8250/8350 require optional jigs for spectral correction. A Rhodamine B ethylene glycol solution is also included as a standard and additional sources for correction can be obtained separately.
Absorbance Spectra Measurement
Obtains the transmittance, absorbance, or reflectance spectrum by measuring the synchronous spectrum of a sample. The optional FUV-830 Absorbance measurement cell block is required for absorbance and transmittance measurements while reflectance measurements require an integrating sphere.
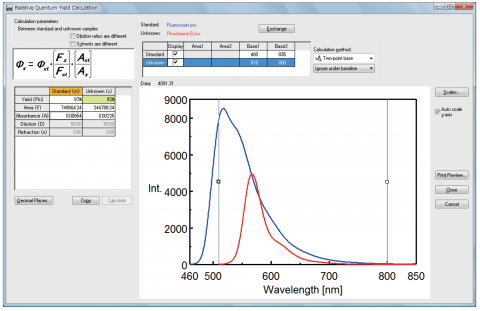
Relative Quantum Yield
All models in the FP-8000 Series include a relative quantum yield calculation program as standard.
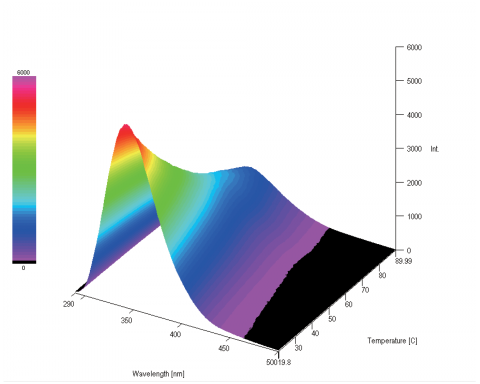
 3D Measurements
Allows for the simultaneous display of several different sets of data, including 2D, 3D, and synchronous spectra. The 3D plots can be viewed in Contour, Color 3D, and Color-mapping.
Validation
The validation program includes instrument test procedures in compliance with JIS (K 0120 2005) and JAIMAS (0004-2005). This program provides six performance tests including wavelength accuracy, wavelength repeatability, resolution, stray light, sensitivity, and photometric stability. The test results and procedures can be saved and/or printed.