ferro.lyte® è l'analizzatore portatile di metalli ottimizzato per l'uso nella produzione, nella lavorazione e nel riciclaggio dei metalli. Utilizza il principio della spettrometria di emissione ottica (OES) noto come "spark", cioè eccitazione a scintilla.
A differenza degli strumenti portatili convenzionali, ferro.lyte® consente di analizzare con precisione anche gli elementi con numeri atomici bassi come C, P, S, B, Li, Be, Ca, Si, Mg, Al e di determinare anche l'azoto in duplex in pochi secondi.
Un analizzatore portatile di grande flessibilità
ferro.lyte® convince con il suo design innovativo, sviluppato per la massima facilità d'uso. Anche senza carrello, il supporto integrato per la bomboletta di argon e per la sonda manuale ne permettono la semplicità di spostamento e sicurezza di utilizzo. Grazie al peso ridotto (pesa meno di 16 kg) e al design compatto, ferro.lyte offre le condizioni ideali per analisi PMI e/o in luoghi difficili da raggiungere.
Determinazioni accurate
ferro.lyte® è leggero e compatto; inoltre, grazie al suo design, è flessibile e veloce da usare come un palmare. Per ciò che concerne le prestazioni analitiche, ferro.lyte è accurato quanto uno strumento da laboratorio: parametro necessario per la qualità.
Operatività rivoluzionata
L'intuitiva interfaccia utente consente una navigazione rapida attraverso le impostazioni del dispositivo e i flussi di lavoro. Ad esempio, l'utente può scegliere quali funzioni del software visualizzare nella finestra principale, tra la visualizzazione dell'analisi classica o l'ID della lega con valori target ed effettivi. Il touch screen chiaro e luminoso è facile da leggere anche nelle condizioni di illuminazione più difficili, grazie alla tecnologia di bonding ottico.
Facile come premere un pulsante
È possibile esportare i risultati dell'analisi:
- tramite connessione USB o LAN dall'analizzatore;
- tramite connessione Bluetooth o WLAN.
Analisi dell'Azoto in duplex
L'innovativa tecnologia CONLYTE® di Elementar migliora sostanzialmente le prestazioni analitiche per l'azoto in duplex e ne aumenta la stabilità a lungo termine per la misurazione di fosforo, zolfo e boro. Contrariamente ai sistemi convenzionali, ferro.lyte utilizza un intervallo di lunghezze d'onda esteso per determinare il contenuto di azoto, prima rilevabile solo con strumenti di laboratorio.
L'estensione della gamma di lunghezze d'onda è resa possibile dall'eccezionale tecnologia CONLYTE® sviluppata da Elementar (in attesa di brevetto). Grazie alla tecnologia CONLYTE, lo spazio tra il canale luminoso e il plasma (tipico degli spettrometri mobili) è completamente sigillato dall'atmosfera. Pertanto, le condizioni ambientali non possono incidere sul segnale di misurazione, il che è essenziale per ottenere sempre analisi affidabili e riproducibili.
Cloud
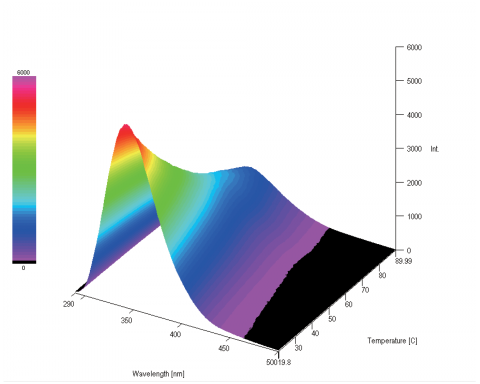
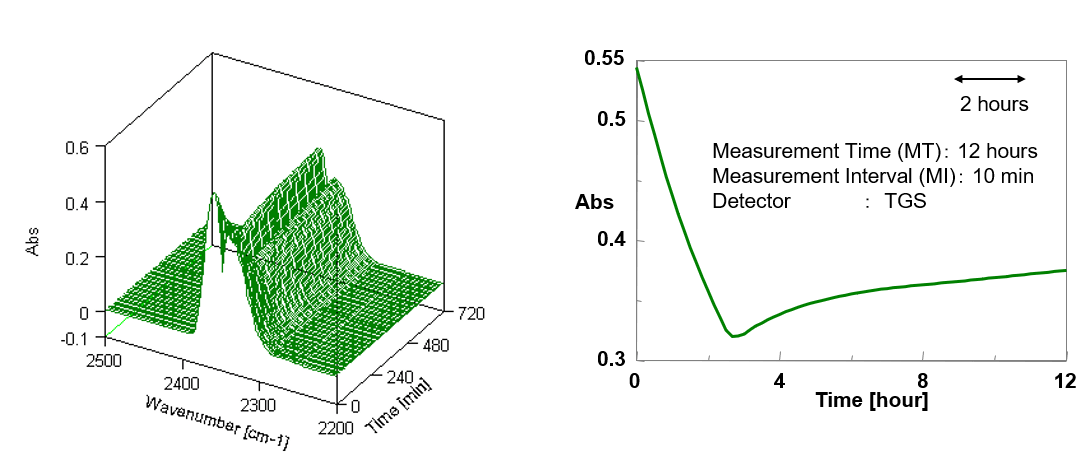
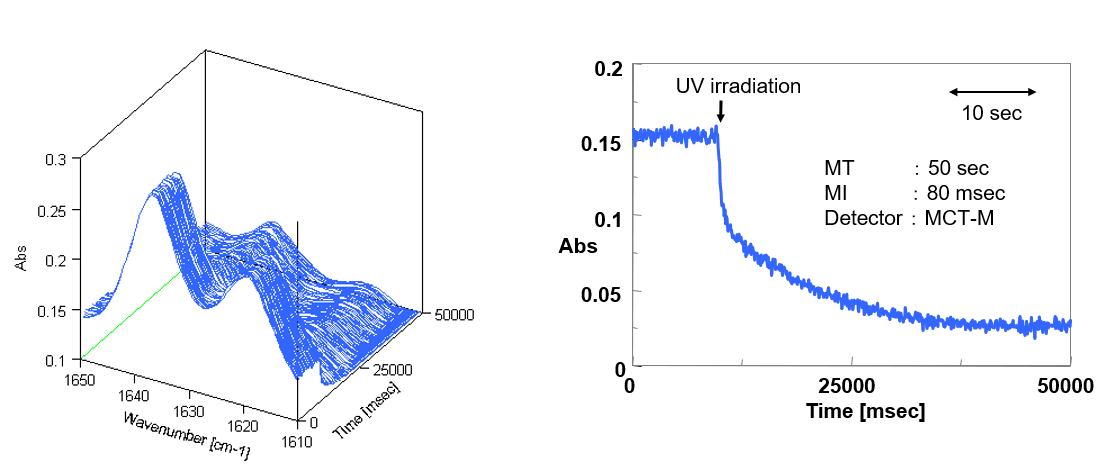
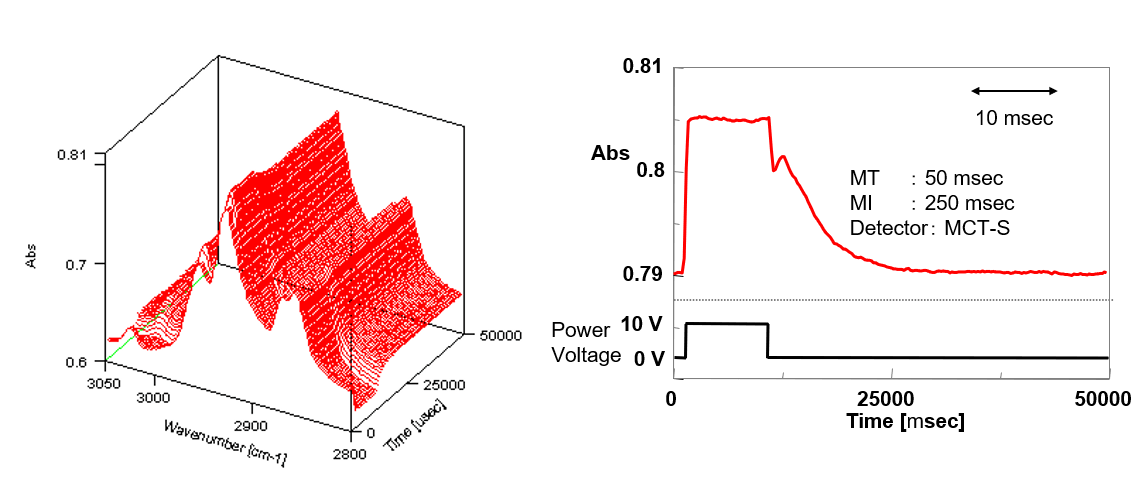
 3D Measurements